1 · Build the population
We assemble a simulated version of your town, city, campus, or hospital from ordinary data — who lives where, how people move, what services exist. Each person is a realistic individual, not an average.
 Sign in
Population simulation, in plain terms
Social Systems Engine (SSE) is software that builds a working model of a real place — a town, a city, a campus, a hospital — and the people in it. Once you have that model, you can try a decision on the simulation first: run an evacuation, an outbreak, a policy change, or a rush of demand, and see how it's likely to play out before you commit to it in the real world.
What it is
Big decisions that involve a lot of people are hard to test in advance. You can't run a real evacuation twice to see which warning order clears a town faster, or expose a real city to an outbreak to compare responses. Social Systems Engine (SSE) lets you rehearse instead — it creates a realistic, simulated population and lets you watch how a plan plays out, as many times as you like, with no real-world cost.
It works because people are not random. Each simulated person has a few stable characteristics that stay the same, but show up differently depending on the situation — the same person behaves one way at home, another in a crowd, another in a crisis. Put thousands of them together in a model of a real place and realistic group patterns emerge on their own.
A real run
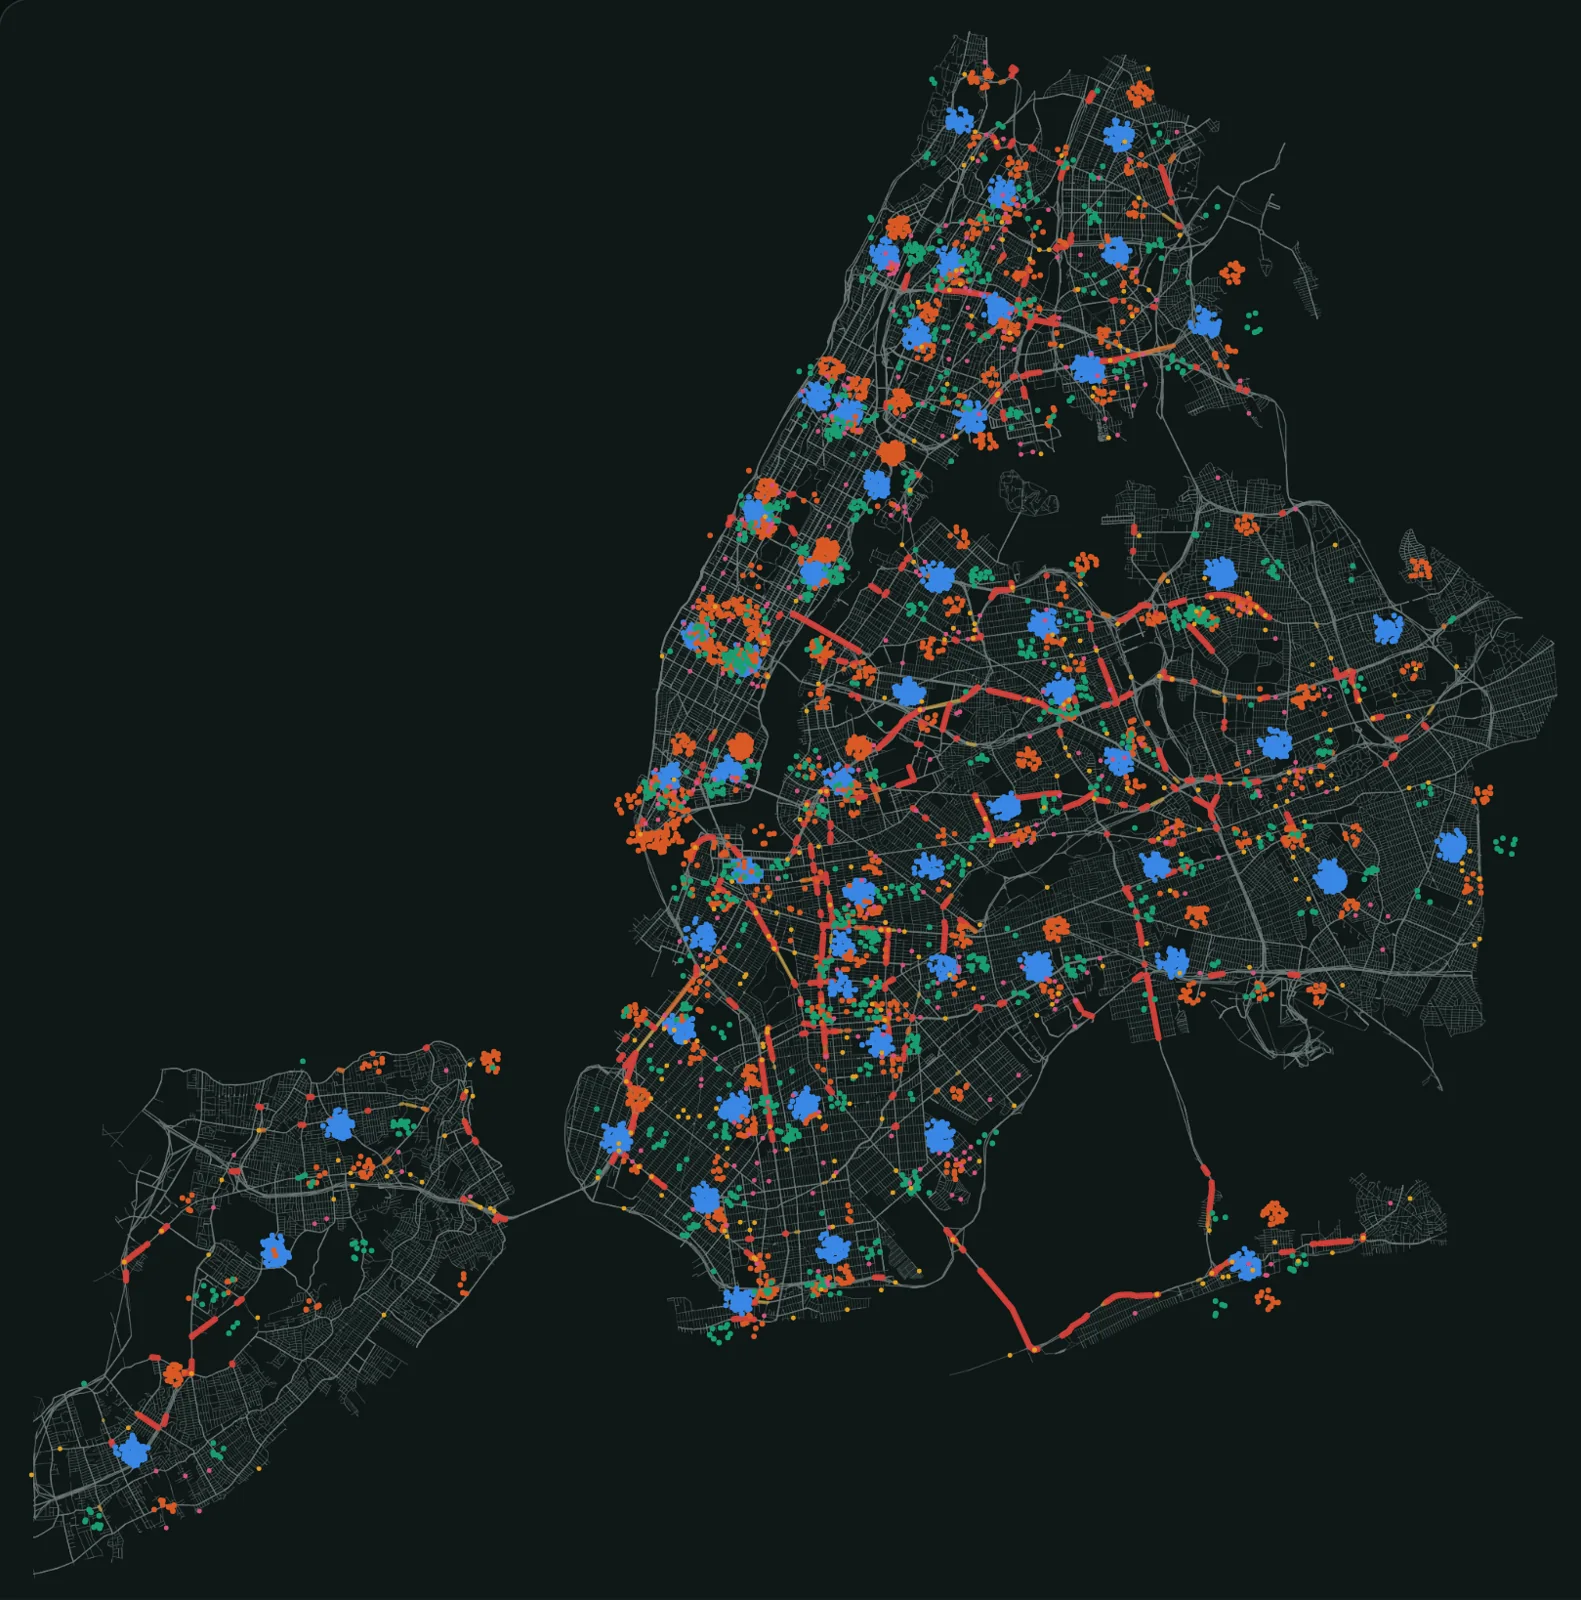
This is not an animation made for the page. It is the output of the Social Systems Engine (SSE): New York's residents in households, built from census records, living an ordinary winter weekday. Every car and every walker goes along the city's own streets, on the route the engine chose, and waits at signals and in queues where the roads fill. The coloured roads are the engine's traffic. Each dot stands for about 810 New Yorkers. Press play, or drag the timeline.
Loading the run…
Real engine output, simplified for the web: the engine saves where everyone is every 10 minutes, and between two saves a traveller's dot moves along the streets of its route; the dots at one place are spread around it so they can be seen; subway and bus riders are counted but not drawn. The model has only New Yorkers' own trips: taxis, trucks, buses and the commuters who drive in from outside the city are missing, which is why Manhattan's streets are faster than they really are. A single run with one random seed.
A separate Saturday run
The same New York population and street network, living a Saturday instead of a Tuesday. This separate Social Systems Engine (SSE) run shows Saturday 20 December 2025 after eight days of warm-up. Cars and walkers follow the routes the engine chose; the coloured main roads show the traffic it produced. Each dot stands for about 810 residents. Play this day, or drag its own timeline.
Loading the run…
A separate, single-seed Saturday scenario from real engine output. Ten-minute snapshots are replayed along the recorded routes; transit riders are counted but not drawn. The model includes residents' own trips, with the same limitations as Tuesday: inbound commuters, visitors, taxis, trucks and bus vehicles are not represented. These are simulated conditions, not observed traffic for that date.
Los Angeles · three separate cases
Compare normal daily life with separate earthquake and wildfire preparation cases. All three replays come from the same SocialSim study, generated through Tools → City data → LA Preparation. Each has its own road map, traffic layer, state strip and time controls.
Illustrative, uncalibrated models. These outputs do not predict casualties, structural damage, fire spread or verified evacuation times. Public streets remain passable in these cases. The display day is Tuesday 16 December 2025 after four warm-up days, not a reconstruction of a historical incident.
Los Angeles · Normal daily life
The starting point for both preparation cases: 9,855 simulated people in 4,051 households go about an ordinary weekday on Los Angeles’s public street network. Homes and workplaces are synthetic cohorts built from public Census and LODES inputs. Cars and walkers follow the routes chosen by SocialSim; traffic colours show modeled delay. Counts below are simulated agents, not measured residents.
Loading the run…
Actual engine snapshots and recorded routes, interpolated for playback. Each dot is one simulated agent. Transit riders are counted but not drawn. Household and workplace locations are synthetic; incoming commuters, visitors and group quarters are omitted. One seed; ordinary mobility and hazard response are uncalibrated.
Los Angeles · Earthquake preparation
The same people, places, seed and roads as the normal case. At 10:00, the official USGS ShakeOut M7.8 shaking scenario introduces an assumed response pressure. Selected modeled services become unavailable for six hours, and people react through SocialSim’s activity and safety planner. Warmer map shading shows stronger source shaking; it does not show predicted building damage.
Loading the run…
Actual engine snapshots and recorded routes, interpolated for playback. Each dot is one simulated agent. Transit riders are counted but not drawn. Household and workplace locations are synthetic; incoming commuters, visitors and group quarters are omitted. One seed; ordinary mobility and hazard response are uncalibrated.
Source: USGS ShakeOut earthquake scenario. Response pressure and six-hour service interruptions are modeling assumptions.
Los Angeles · Wildfire preparation
This replay starts with the same normal-day baseline as the run above. At 10:30, a prescribed full-compliance evacuation order sends modeled households whose homes fall inside the historical final Palisades 2025 perimeter or an assumed two-kilometre warning buffer toward safe modeled refuges. Follow them leaving, traveling on the recorded street routes and arriving below. Refuge locations are synthetic, not official shelters; this is a planning demonstration, not a forecast or reconstruction.
Loading the run…
Evacuation response · modeled agents
Actual engine snapshots and recorded routes, interpolated for playback. Each dot is one simulated agent. Transit riders are counted but not drawn. Household and workplace locations are synthetic; incoming commuters, visitors and group quarters are omitted. One seed; ordinary mobility and hazard response are uncalibrated.
Source: CAL FIRE Palisades incident and its official historical final perimeter. The warning buffer and household response are modeling assumptions; there is no fire-growth, smoke or wind model.
The simulation environment
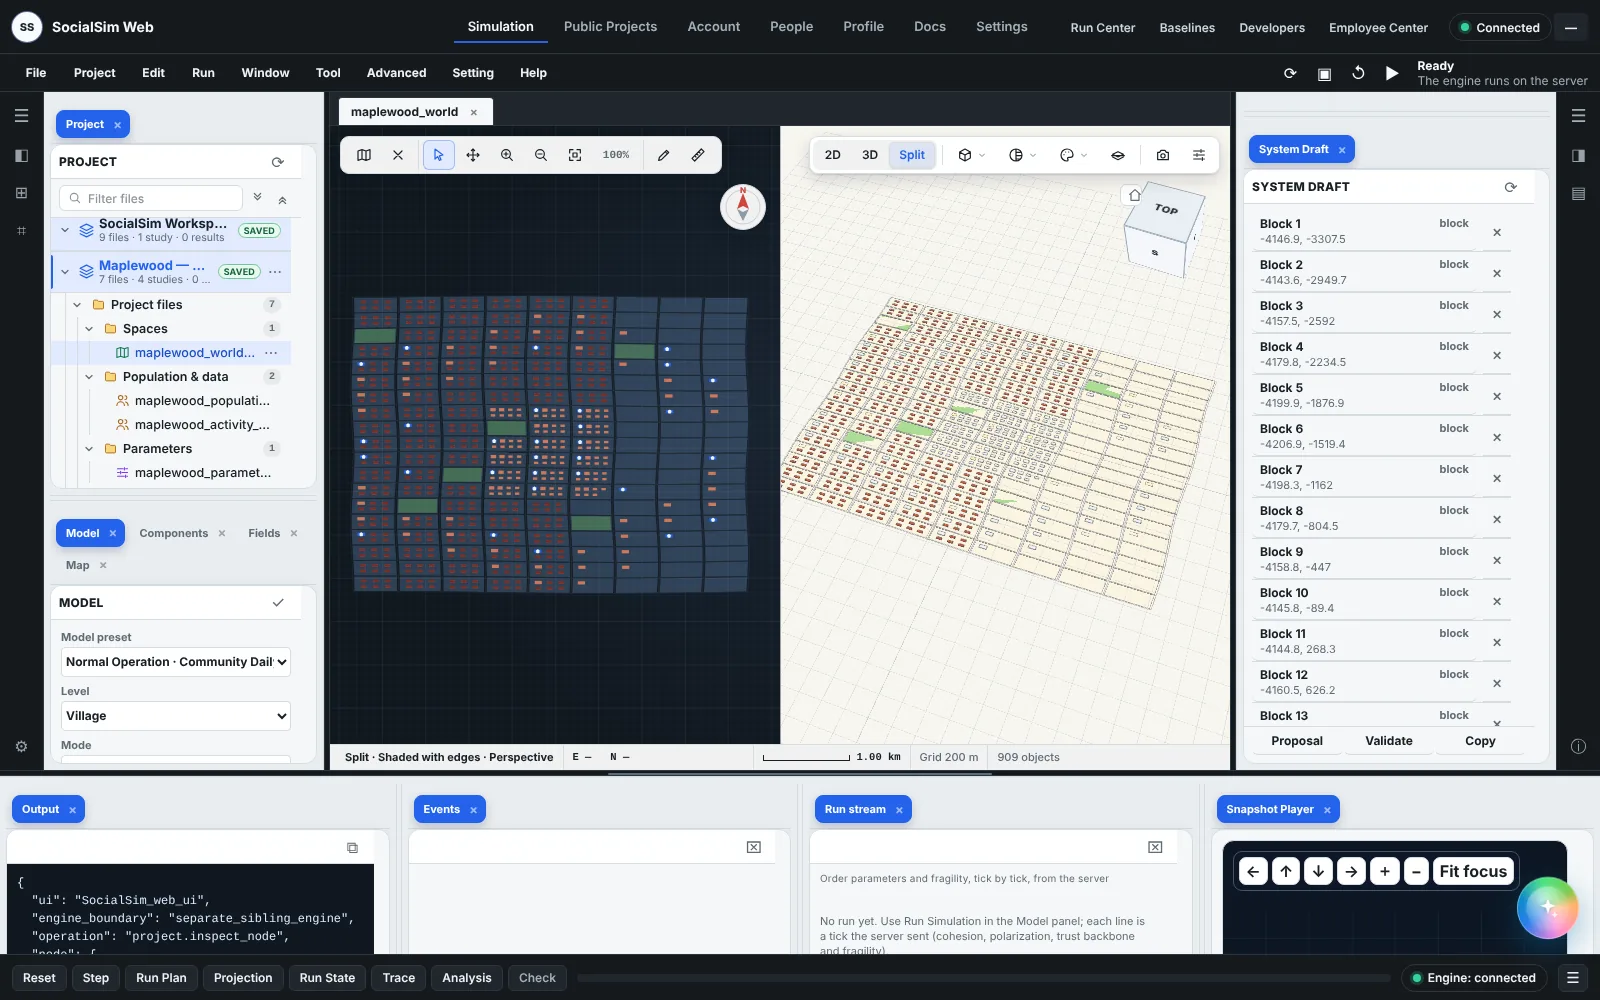
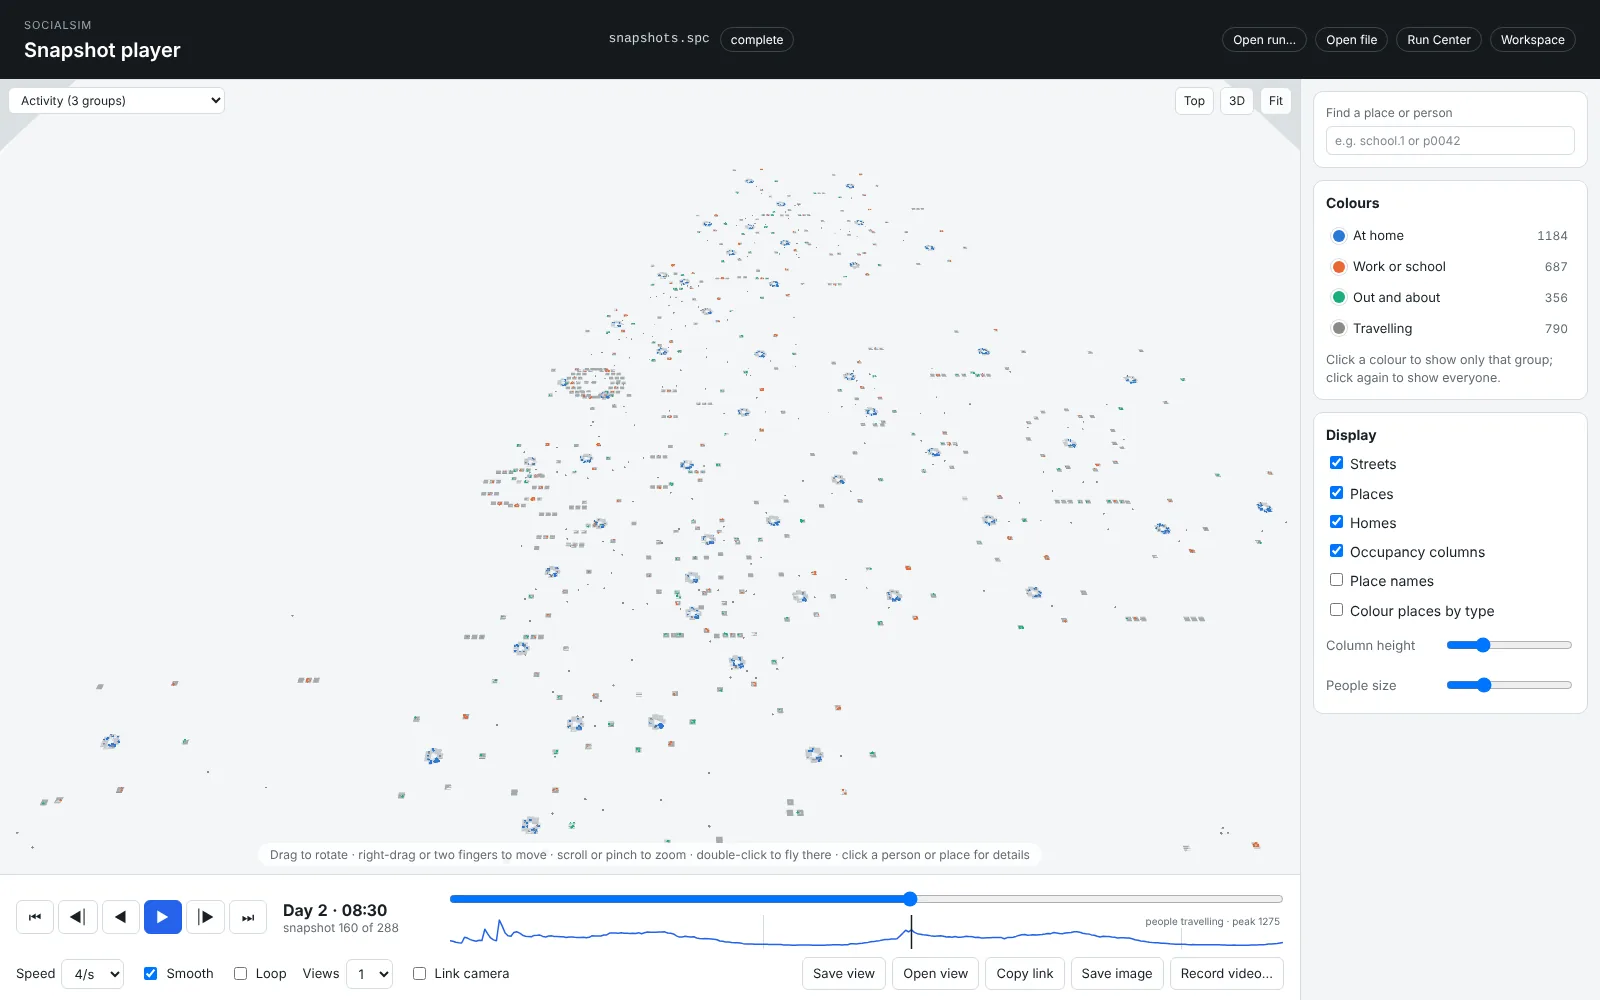
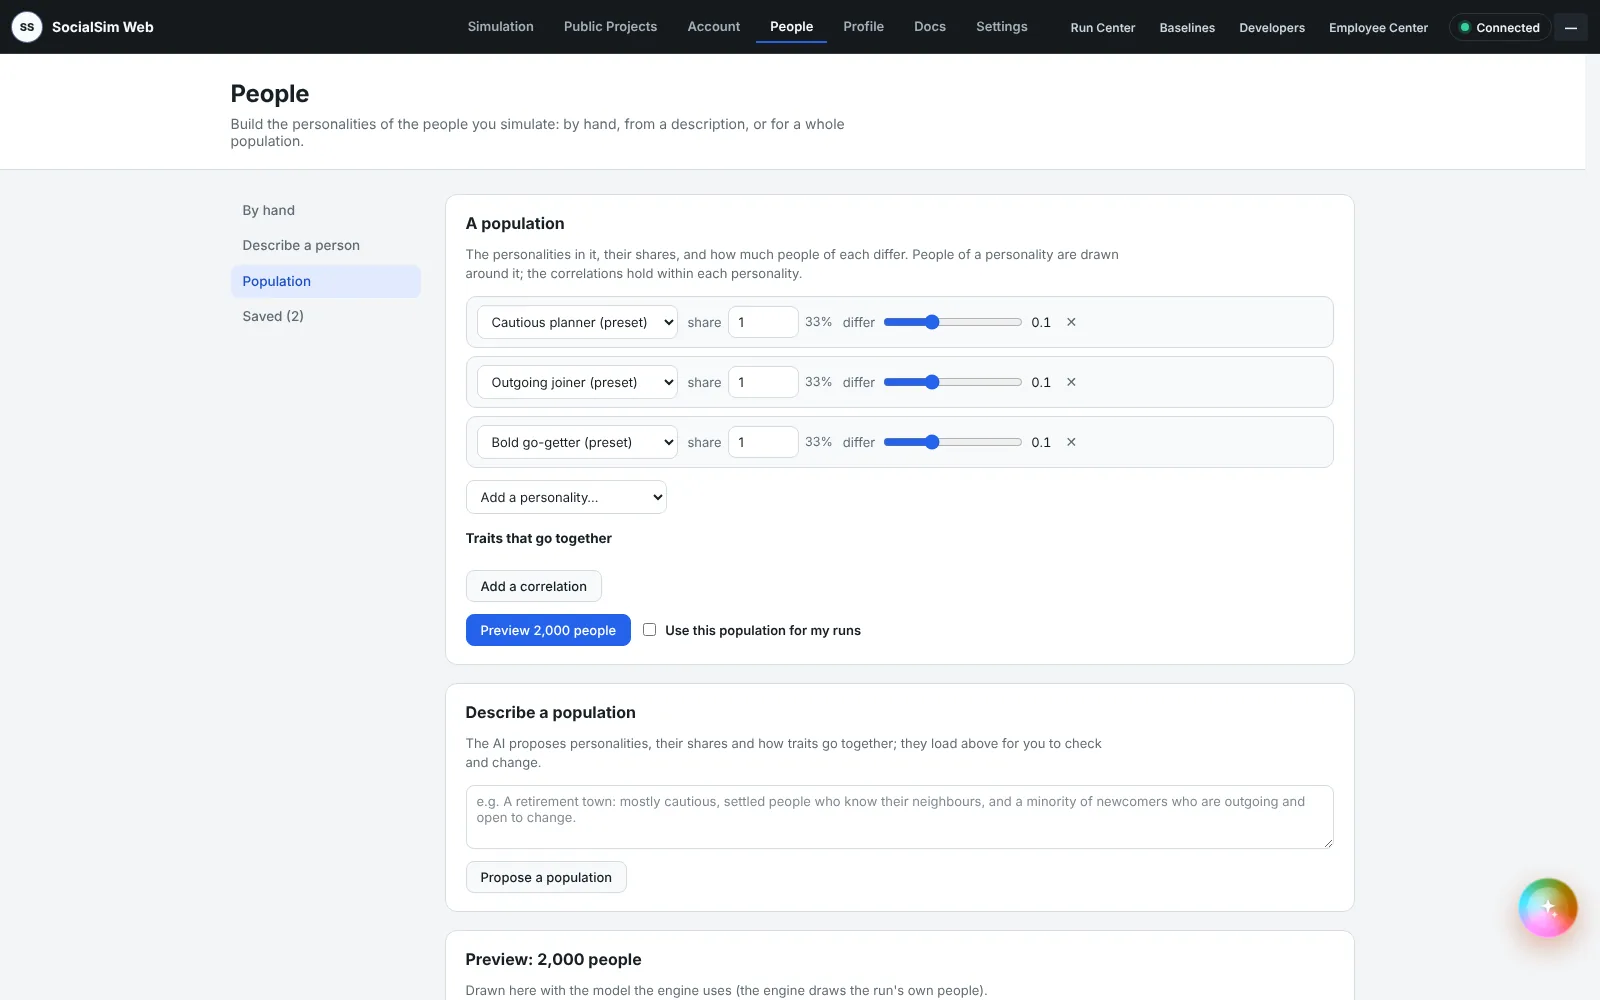
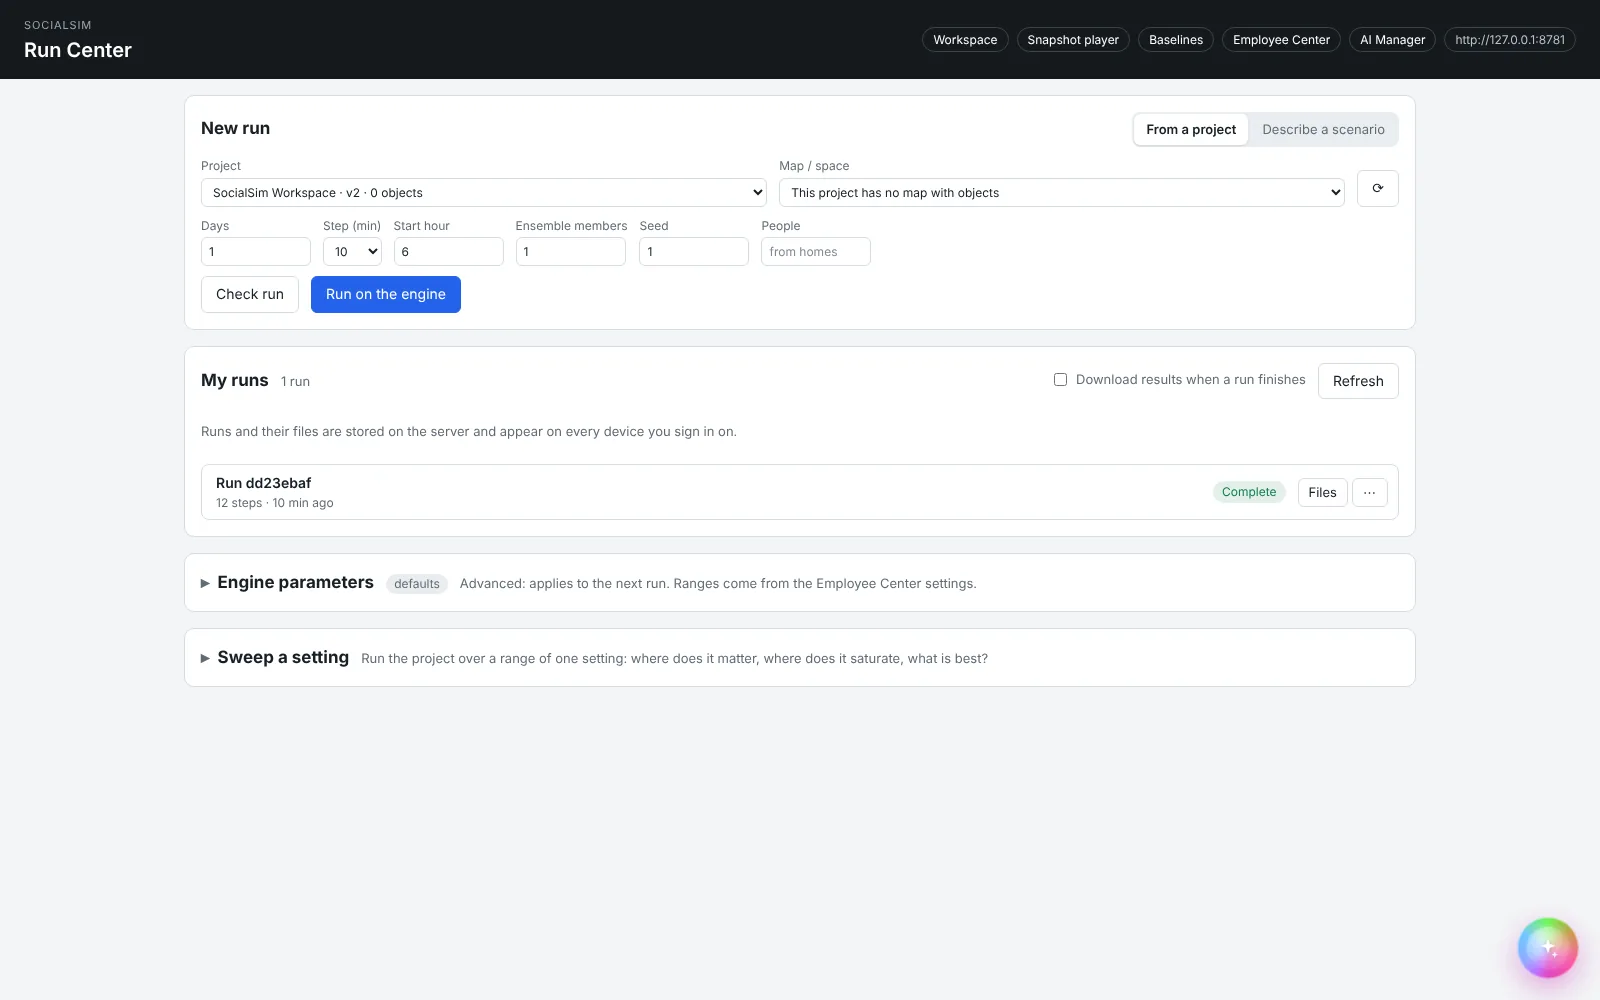
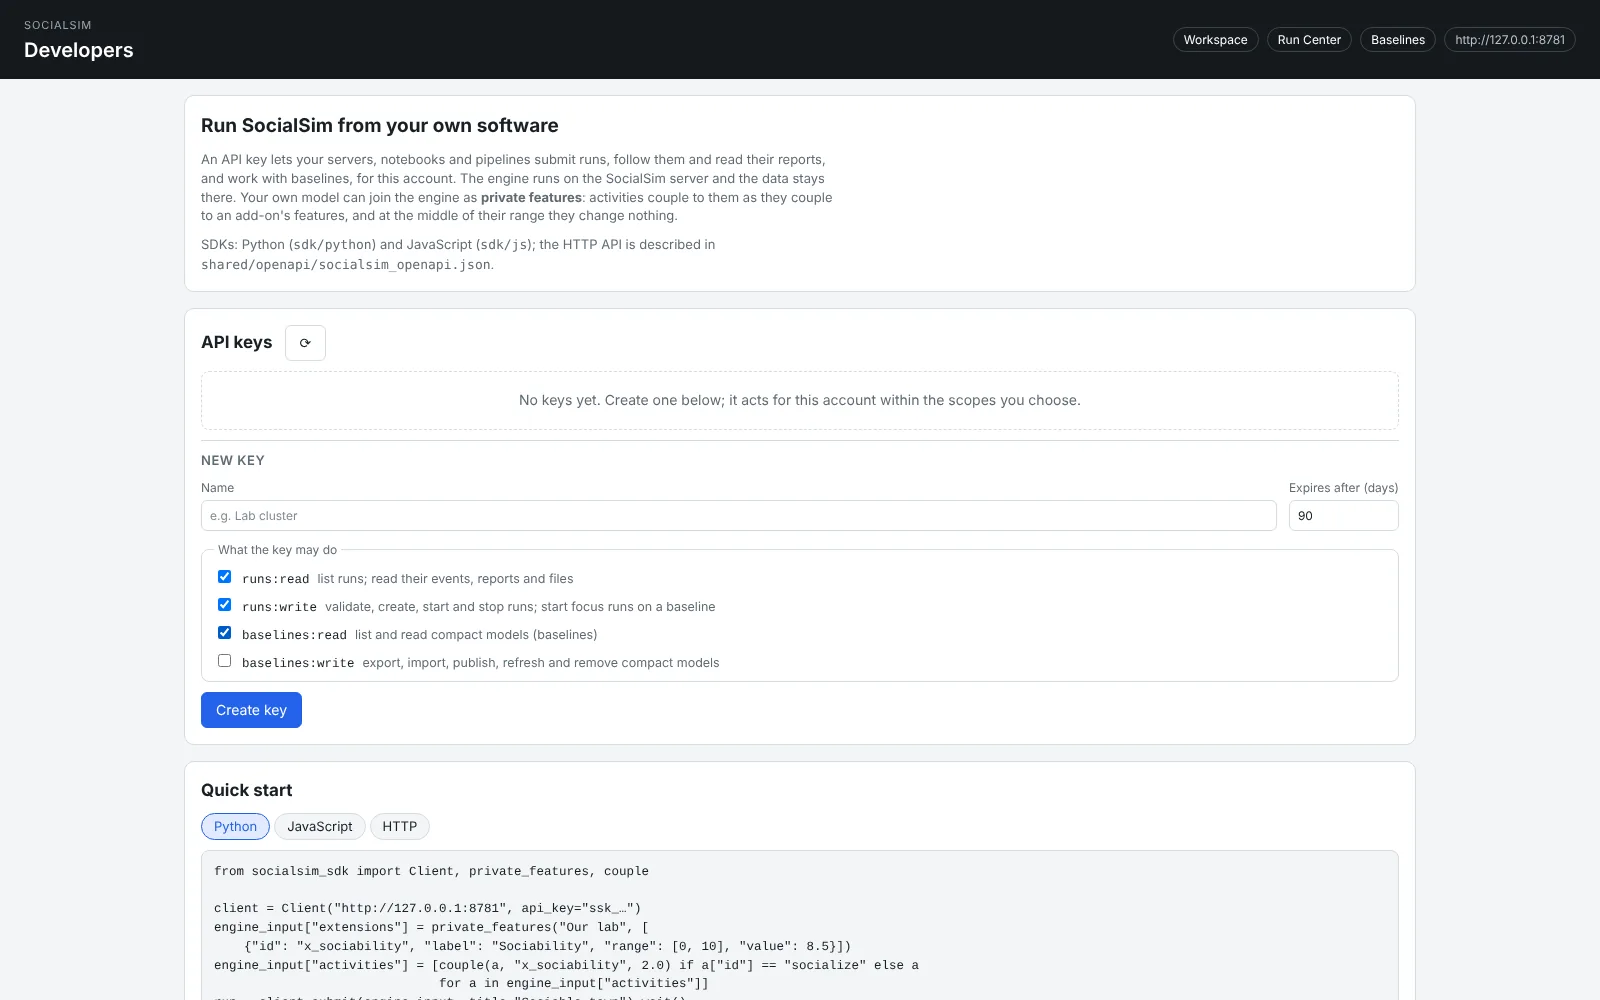
Social Systems Engine (SSE) runs in the browser against our servers. These are screens of the application as it is today, with the run above loaded where a run is shown.
Results from studies
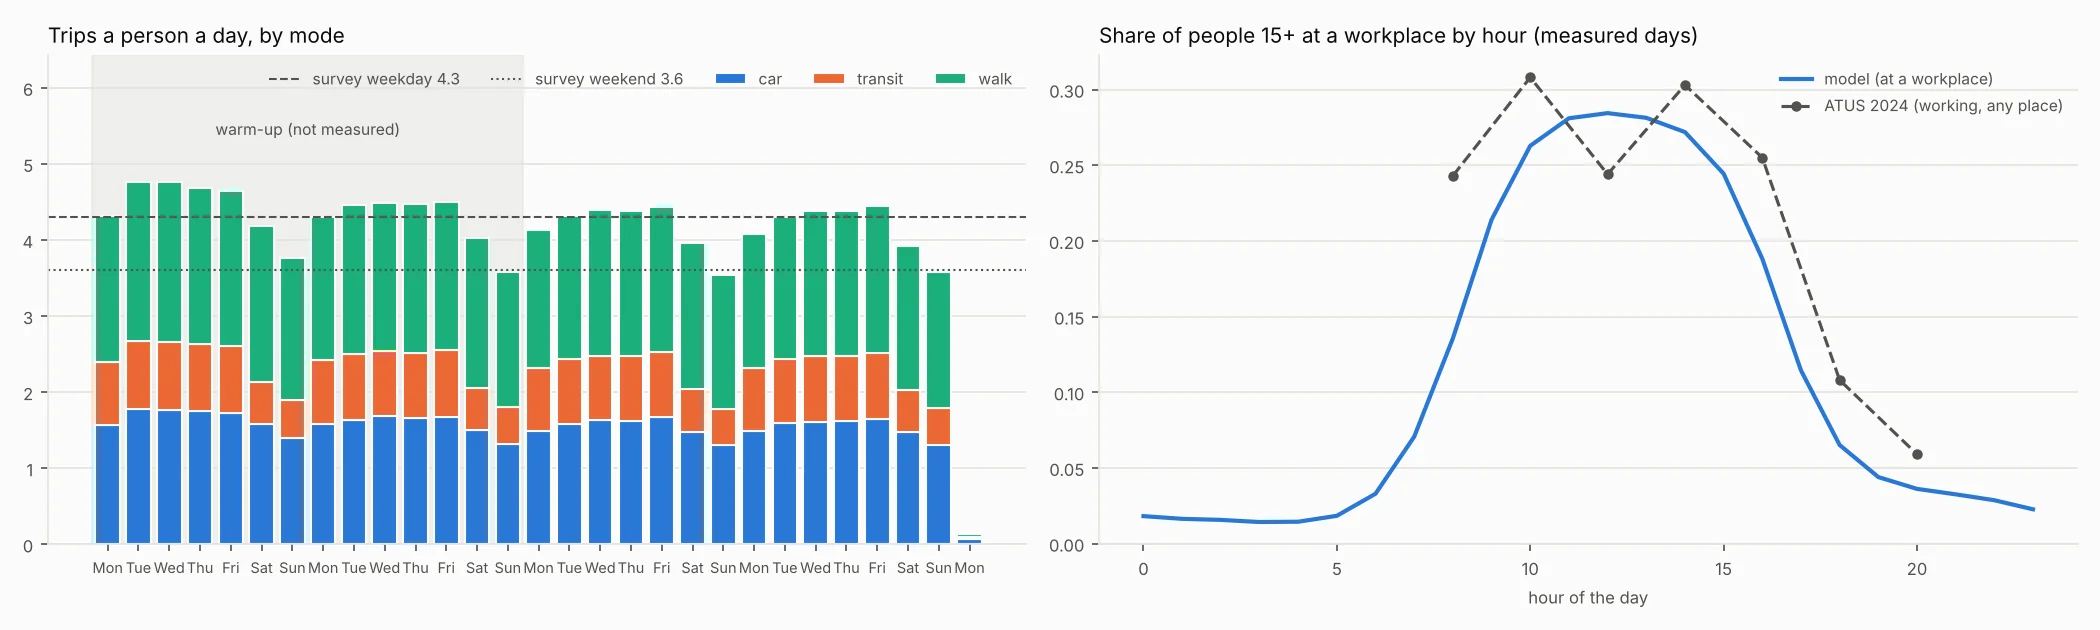
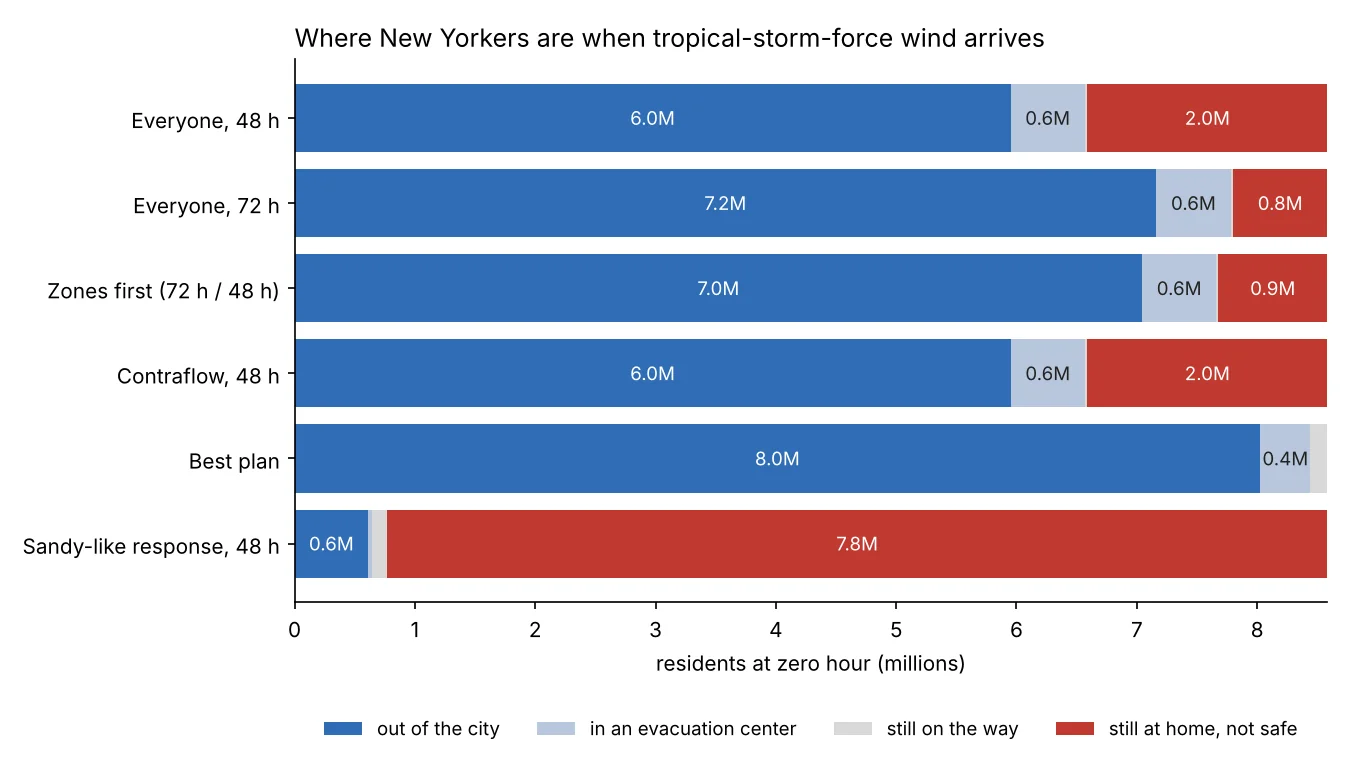
A model of a city is only useful once its ordinary days look like the real city's. We run it, compare it with data it was not built from, and change what misses. Then we ask it questions.
A toy model to play with
A small agent-based model that runs in your browser, separate from the engine. Each dot is an autonomous agent moving through a shared world; a behavior (here, a simple contagion) spreads through contact. The chart at the bottom tracks the population over time. Change the contact rate, recovery rate, or population size — or click to seed a new case.
Illustrative agent model for demonstration. Real Social Systems Engine (SSE) studies use domain data, validation, and review rather than this simplified contact rule.
Trait city model
This second model gives every simulated person four continuous characteristics. Blocks act like rooms in a city grid: people bounce off block edges, slip through openings, and exchange traits under rules you can change while the model runs.
This city model is exploratory and illustrative. It shows how multiple individual characteristics can move through structured space under explicit rules; it is not a calibrated social forecast.
How it works
No modelling background needed. You bring the question; Social Systems Engine (SSE) handles the simulation and hands back results you can act on.
We assemble a simulated version of your town, city, campus, or hospital from ordinary data — who lives where, how people move, what services exist. Each person is a realistic individual, not an average.
Set up the situations you care about — an evacuation order, an outbreak, a price change, a closure — and run them. Change one thing and run again to get a fair, side-by-side comparison.
You get decision reports, maps, and risk curves showing how each scenario played out and which choice did best — in plain language you can take straight into a meeting.
What it's for
The same simulation can stand in for very different situations — anywhere a decision depends on how a population of people will behave.
Plan wildfire, flood, or storm evacuations: where people go, where roads jam, and which warning order clears a town fastest.
Study public-health-style scenarios only after the core engine is fully validated and the domain layer is ready for release.
Explore how turnout, coalitions, and public opinion could shift under different scenarios across a population.
Stress-test pricing, supply, and demand: how a market, a rental portfolio, or a retail footprint responds when conditions change.
Model how students, staff, or visitors move through a campus or building, and test schedules, capacity, and layout changes.
See how a surge of patients could stress a hospital's beds, ICU, and staff — and compare plans for handling it. Scenario planning, not clinical advice.
In the app today
The engine runs on Matter Tech's servers, not in your browser, so a run can be as small as your own week or as large as a state. Your projects and runs stay with your account and follow you to any device you sign in on.
Simulate one person, a family, a class, a company, a town, a city, a state or a country with the same engine and the same rules.
Start runs, follow them as they go, and keep every run and its files with your account.
Run your own family inside your city's published run. A city can pay for its residents' runs.
Replay a run in 3D: follow a person, watch places fill and empty, and save a view or a video.
Organisations run the engine from their own software in Python or JavaScript, with keys they control.
Your runs are yours. A shared baseline holds totals by area, with small groups hidden.
A real test
We replay a past storm from public data and let the engine grade itself against what was recorded on the ground. The county, the schools and employers decide by rule during the run; nothing about the outcome is given to it.
Of 31 recorded measures, 10 come out close, 7 in the right order but off, and 14 far. The far ones (how many people left the county, how long the power stayed out, the fuel shortage) are what we are working on next.
Who it's for
You don't need to be a modeller. Social Systems Engine (SSE) is for decision-makers — city officials, emergency managers, health departments, school administrators, insurers, and businesses — who need to weigh options before committing real resources.
Results are conditional what-if scenarios meant to inform a decision, not predictions about any specific individual.
Social Systems Engine (SSE)
Social Systems Engine (SSE) applies simulation thinking to social systems. Social Systems Engine (SSE) begins with Population Behavior Simulation — a tool for studying how people, institutions, resources, rules, and interventions change over time.
One engine, one platform. The challenge of making decisions about populations under uncertainty, with limited resources, shows up almost everywhere — and that is exactly what Social Systems Engine (SSE) is built to help study.
Domain packs
The engine does not need to know whether an entity is a person, a deer, a crop field, or an agency team. Each is a canonical entity with requirements, behaviors, resource dependencies, and constraints. Swap the entity definitions and the same platform studies a forest as naturally as a neighborhood.
Vegetation as a resource stock, predator and prey behavior, wildfire interventions, and migration movement.
Fishery populations, pollution as resource degradation, protected areas, and institutional constraints.
Crop yield as a resource stock, weather as interventions, labor and equipment as service capacity.
People, households, services, and rules — testing interventions before they are committed.
Surveys, tracking records, territory maps, and monitoring data populate scenarios.
Support careful review for conservation, restoration, resilience, and resource decisions.
Social Systems Engine (SSE) simulation
Designed as a workbench for building scenarios, viewing layers, running studies, and reviewing results with care.
Access the tool
Run Population Behavior Simulation online, or choose a desktop edition when it becomes available for your platform. Approved accounts start on the free plan; see the plans.
Social Systems Engine (SSE) is rolling out through approved access. Desktop editions are in preparation — leave a note and we'll tell you when your platform is ready.
The science
Social Systems Engine (SSE)'s new formulation — the Dyadic Attraction–Repulsion Model — treats human social behaviour as an interest relation that splits into attraction and repulsion, settles into a social potential well, and separates a person's fixed characteristic from its context-dependent manifestation (whose group fixed point is culture). Below: plain-language explanations of the model and the engine that realizes it, each with the real equations and a live graph. Open any topic from the tabs in the page margins, or read them here.
Social Systems Engine (SSE) is an in-development research framework — these are its own definitions, not established results.
The full research foundation is set out in the Social Series — plain-language descriptions of the principle and how it extends to crisis, markets, elections, public health, and more.